“Augusts in Seattle are getting hotter, leading to a change of 3.5°F since 1970.”
This was the sentence that caught my eye while reading an email from Peter Gerard, director of communications for Climate Central, an organization that prides itself on helping news reporters tell an accurate story of climate change.

I wondered immediately: Is there something special about the month of August? It turns out that there is, at least for Seattle and most areas around Puget Sound, but I needed to see the evidence for myself.
Thus began my journey down a rabbit hole of climate statistics in the Puget Sound region and across the state. I eventually dragged two experts — Washington State Climatologist Nick Bond and Climate Central meteorologist Sean Sublette — down into the hole to guide me. I found myself in a flood of data. These two experts showed me some clever tools to corral the numbers. And I finally emerged with a greater understanding of the pitfalls that climatologists must overcome to make sense of recorded temperatures as they try to forecast the future of climate change at the local level.
As Nick Bond stressed to me, temperature increases in one locale make up just a small piece of the overall climate-change picture. Most of the heat trapped in the changing atmosphere is absorbed into the ocean, he noted. Those oceanic conditions drive major shifts in weather patterns across the globe. Still, the increasing air temperatures that we measure locally can have a profound effect on plants and animals — including humans.
The heat wave of late June in the Northwest was a prime factor in the confirmed deaths of 100 people in Washington state — far above normal, according to the Washington State Department of Health. Heat may have contributed to the deaths of many others. Historically, June is an unlikely month to break all-time heat records, but climate change is altering a multitude of conditions and increasing the risks of perfect storms at unexpected times.
Because extreme heat can have devastating effects on humans and the natural ecosystem, I wanted to know how big this problem was in the past and how the trends are changing. While historical records have some problems, I learned that anyone interested could use tools readily available online to plot temperature trends and get an idea of how things are changing. I’ve added some footnotes along the way for those who would like to follow what I’ve been doing.
Starting point is critical
The first step in my journey through the numbers was to check the ongoing change in the average temperature for the month of August. But where does one begin? I quickly learned that when looking at trends, it makes a difference whether you start during a warm or cool period.

For example, looking at Sea-Tac temperatures with a data-analysis tool by NOAA’s Applied Climate Information System, the trend from 1970 to 2021 is an increase of 3.4 degrees along a trend line that incorporates every average for August through 51 years. (See first graph at right.) 1
A trend line does not usually begin or end on the same temperature as the first or last data point in the series, but the starting and ending points can strongly influence the trend. For example, if one starts at 1973 (second graph), the change along the trend line to 2021 is 3.9 degrees.2 That’s a full 0.5 degrees higher than if one starts just three years earlier. The trend line becomes tipped by starting at 61.6 degrees for August 1973 instead of 64.5 degrees for August 1970 (along with the removal of three data points — 64.5, 67.7 and 66.7 for August 1970, 1971 and 1972, respectively).
One could say that the average temperature in August has gone up at Sea-Tac about 3.4 degrees since 1970 or 3.9 degrees since 1973. I also plotted the average of the maximum daily temperatures for August and found they had gone up by 4 degrees since 1970 (88° to 92°) or 5 degrees since 1973 (87° to 92°).3
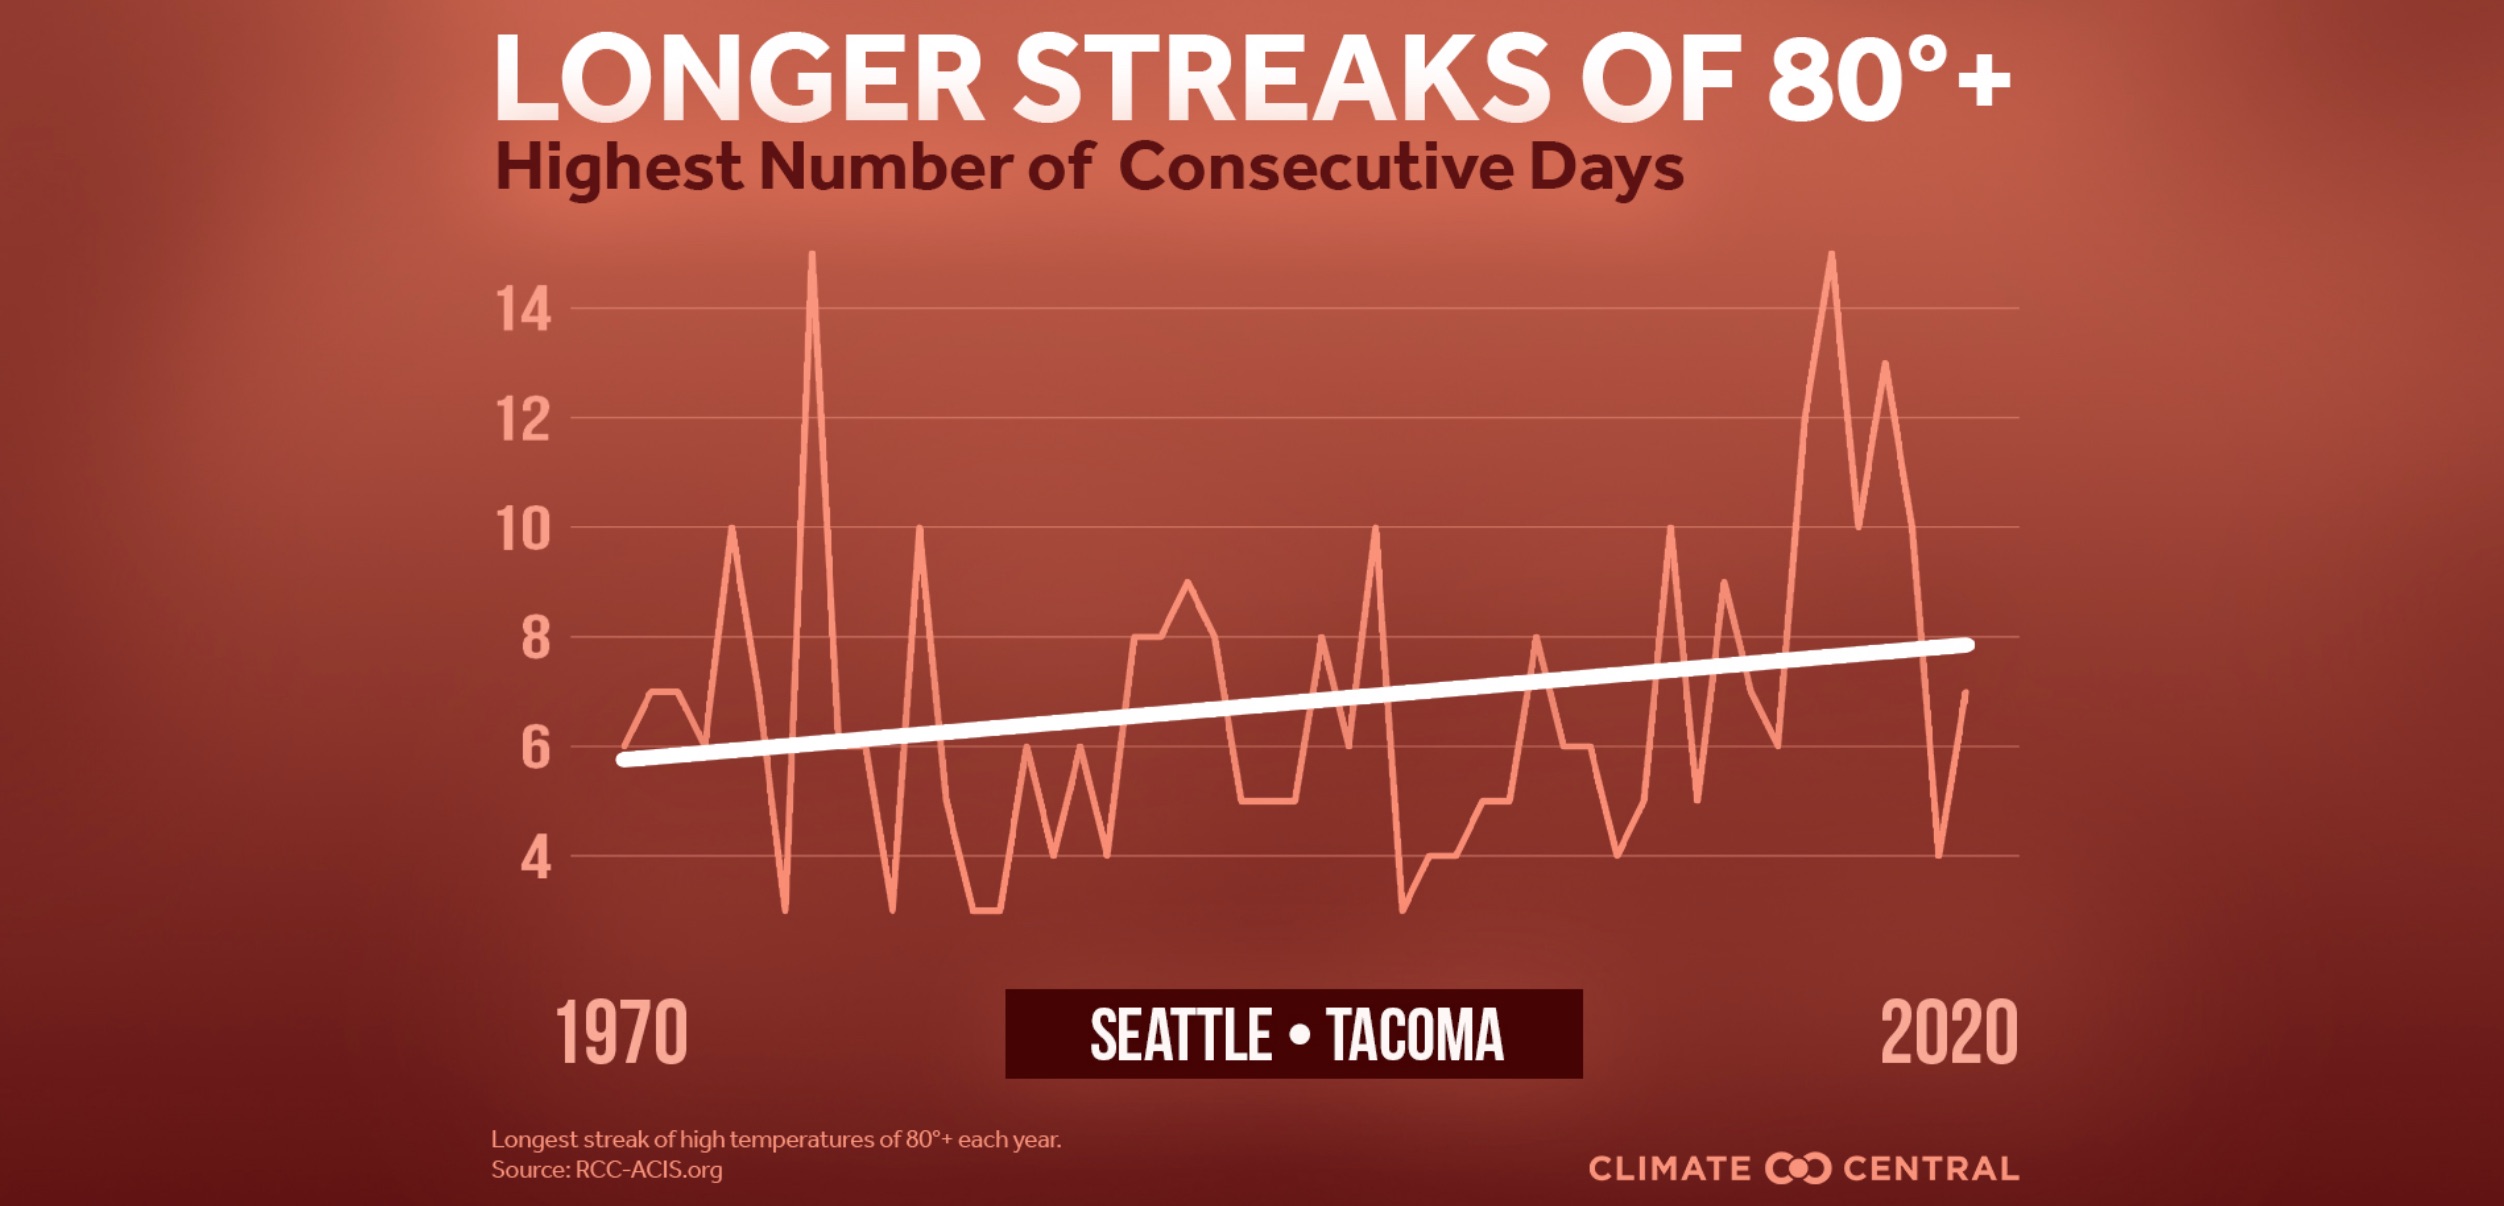
Because heat extremes have an effect on health, one can also choose a temperature and see how many consecutive days reach that level, as in the graph at the top of this page. For example, I picked 90 degrees and asked how many times we saw that temperature at least two days in a row. From 1940 to 1981, the answer is 21 times.4 But from 1980 to 2021 — the same number of years — the answer is 43 times, about twice as often.5
You can pick any temperature and any length of “streak” for that temperature. Looking for at least three days of 85-degree heat, I found an occurrence of 27 times from 1980 to 2000 and 68 times from 2001 to 2021.6
What about a streak of at least 80 degrees for four days? The occurrence was 26 times from 2000 to 2010 and 63 times from 2011 to 2021.7 Even the changes in the last 10 years are significant with no cooling trend in sight.
Some people have noticed that the nights seem to be growing warmer, too. Plotting the average of the minimums, I found that the lowest temperatures in August have gone up at Sea-Tac by 4 degrees (49° to 53°) since 1973, slightly less for 1970.8
August normally cooks
Why the focus on August? It turns out that for much of the Puget Sound region, August is not only the hottest month of the year on average, but it is also the month in which the temperatures have been rising faster, year to year, than any other month.
While these numbers and the resulting trends may be revealing and are a good place to start, their value is limited by the time scale, starting and end points, and choice of a single location (Sea-Tac).
“It gets complicated, and the potential for cherry-picking is really high,” Nick told me. “You have to really guard against that.”
The goal is to dig into the numbers to understand what is happening, he said, not to support anyone’s convictions. Climatologists have spent considerable time trying to confirm historical temperature records and clear out discrepancies.
Across the country, it is easier to obtain complete and consistent data since 1970, according to Sean Sublette, explaining why Climate Central often uses that time period as a reference. But, as Sean points out, one may get a better idea of a long-term trend by considering a longer time scale. Since Sea-Tac data go back to 1945, we can see that the change in average August temperature from 1945 to 2021 is 5.3 degrees along the trend line. 9
For the sake of comparison, that’s 0.70 degrees per decade if you start from 1945, 0.67 starting at 1970, and 0.81 starting at 1973. So if one wanted to cherry-pick the data for a more extreme temperature rise, the starting year would be 1973.
Despite these differences, it is clear that the temperature is going up at Sea-Tac in a very significant way, no matter when one starts the graph. While I’m just fumbling with local numbers in relatively recent history, climate experts have made a compelling case for climate change by looking back thousands of years. (NASA: “How do we know?”)
Taking a look around
With Sea-Tac findings in hand, I began to look at other locations, using a helpful trend-analysis tool on the webpage of the State Office of Climatology. This data set, which goes back to the 1800s, uses temperatures adjusted for observed biases and inconsistencies, with the most reliable data usually coming in recent years.

By choosing a starting year and selecting a trend range, one can simply move the curser across the map from one location to another and compare the differences. For example, with 1970 as the starting year and a time frame of August, I found a fairly wide range of temperature increases — up to 4.85 degrees in Vancouver in Southwest Washington.
According to Nick, some of the differences may relate to changing conditions around the monitoring stations themselves. Since concrete and hard structures absorb more heat, urbanization can result in a more rapid rise in temperatures than in surrounding rural areas, particularly forested areas. This is known as the “heat island effect.”
Some observers speculate that construction of a third runway at Sea-Tac Airport along with growth in surrounding residential and commercial areas may be responsible for higher temperatures at the Sea-Tac weather station than would have been recorded without that growth.
In any case, by comparing average temperatures from June through September at various locations, it appears that August temperatures are going up the fastest in most areas across the state — although for some stations July is changing nearly as fast or even faster than August. In some areas of Eastern Washington, September temperatures appear to be going up faster than July or August, based on these single-location numbers.
Why August would be growing warmer faster than other months is not easy to explain. One idea is that the ground is becoming drier over time near the end of summer because of our increasing temperatures. Drier conditions mean less evaporation and less transpiration from the leaves of plants. Since the processes of evaporation and transpiration lead to cooling effects at the source, less moisture may mean less cooling to offset the warming of the sun. Still, the variation in weather conditions — including precipitation — makes any specific cause difficult to prove.
Changing the scale
I like the map on the state climatology website because of its simplicity, but Nick advises not to draw broad conclusions from individual locations. Another useful analytical tool, Climate at a Glance, offers a variety of temperature sources. One can look at data for a city, county, state or region or take national or global perspectives using this webpage from NOAA’s National Centers for Environmental Information.

For the Puget Sound lowlands, go to “divisional” and “time series,” and pull down Washington state to pick a region. Since 1945, the average temperature across the Sound for August has gone up 0.5 degrees per decade, as shown in the upper right corner.10 Since 1970, the trend is 0.6 degrees per decade, 11 but it reaches 0.7 degrees with a starting point of 1973.12 This average increase in August temperatures in the Puget Sound region appears to be higher than for most other regions of the state.13
Another interesting way to look at the rising temperatures around Puget Sound is to compare monthly temperatures to a long-term average. For example, the average August temperature from 1901 to 2021 was 63.1 degrees, as shown by the “base period” in Climate at a Glance. 14
From 1901 to 1940, 57 percent of the August averages fell below the long-term average, as shown in the “departure” table below the graph.15 From 1941 to 1980, 52 percent were below the long-term average.16 But from 1981 to 2021, a similar period of time, only 2.4 percent were below the long-term average.17 In fact, over the past 20 years, only one August (2007) fell below the long-term average, and it was just 0.1 degree lower at 63.0 degrees. This is just another way of saying that temperatures have gone up to a remarkable extent over the past 20 years.
When looking at averages for the entire year, not just the month of August, the result is similar but less dramatic. Only six times in the past 41 years did the average annual temperature for Puget Sound fall below the overall 1901-2021 average.18 And that happened only twice in the past 20 years, with the last time coming a full decade ago.19
Heating in waves
Fall weather seems to be setting in even more now, and memories of the summer heat wave in June may be fading, despite long-term damage to the ecosystem from drought, wildfires and over-heated beaches (Our Water Ways, July 13).
For people living in the Northwest, June’s heat wave was like nothing ever seen before. Visits to hospital emergency departments because of heat-related illness were 69 times higher than the same period of June 25-30 in 2019, according to a report from the Centers for Disease Control and Prevention. More than 1,000 heat-related illnesses occurred in Washington, Oregon and Idaho on June 28, when Portland reached 116 degrees and records were shattered throughout the region.
Extreme heat events are predicted to occur more often and last longer, according to Dr. Scott Lindquist, Washington’s acting state health officer, stressing that climate change is a major public-health threat as well as an environmental challenge.
“This huge jump in mortality due to heat is tragic and something many people thought they’d never see in the Pacific Northwest with its mostly moderate climate,” Lindquist said in a news release from the Department of Health. “But climates are changing, and we see the evidence of that with dramatic weather events, major flooding, historic forest fires, and more.”
People over the age of 60 have been shown to be especially vulnerable to heat waves, according to a report in the Canadian Medical Association Journal. Increased illness and the use of more medications among seniors can increase the risk of serious problems, but older people also appear to have less ability to sense heat and respond appropriately, the report says.
For more on heat-related illness, read the CDC report (PDF 676 kb) on the subject.
I had plunged into this jungle of weather statistics to see if I could learn something about climate change at the local level. Did I really need to be convinced that we are living in a world that is growing dramatically warmer? Probably not, but now I have a wider perspective when reading the findings of the Intergovernmental Panel on Climate Change, including “Climate Change 2021 — The Physical Science Basis” as well as new reports scheduled to be released next year.
————-
FOOTNOTES with details of the analytical tools
1 SC ACIS Product selection: Single-station products, Seasonal time series. Options section: Average temp, 1970-2021, month: Aug, ✔Include regression line. Station/area selection: Seattle; click search, click on map for Sea-Tac, GO.
2 Same as footnote 1, with 1973-2021.
3 Same as footnotes 1 and 2 with Options section: Max temp.
4 SC ACIS Product selection: Single-station products, Consecutive days. Options section: 1940-1981, Criteria: Max temp >= 90, All runs >= 2 days. ✔Include start date with results. Station/area selection: Seattle, click search, click on map for Sea-Tac, GO.(The results can be ordered by clicking on the column header.)
5 Same as footnote 4 with 1980-2021
6 Same as footnotes 4 and 5, with Max temp >= 85, All runs >= 3 days.
7 Same as footnotes 4 and 5, with Max temp >= 80, All runs >= 4 days.
8 Same as footnotes 1 and 2 with Options section: Min temp.
9 Same as footnote 1, with 1945-2021.
10 Climate at a Glance Click on divisional, time series: ✔display trend, per decade, Start 1945, End 2021. Average temperature, 1-month, August, Start year 1945, End year 2021. State: Washington, Climate Division: 3. Puget Sound lowlands. Plot.
11 Same as footnote 10 with Start year 1970 for trend and plot inputs.
12 Same as footnote 10 with Start year 1973 for trend and plot inputs.
13 Same as footnotes 10, 11 and 12 with change in Climate Division input to selected options.
14 Same as footnote 10 with ✔Display base period: Start 1901, End 2021.
15 Same as footnote 14 with Start 1901 and End 1940 for trend and plot inputs. Sort “Departure from Mean” by clicking on the column head. Negative numbers are below the average.
16 Same as footnote 15 with Start 1941 and End 1980 for trend and plot inputs.
17 Same as footnote 15 with Start 1981 and End 2021 for trend and plot inputs.
18 Same as footnote 15, with Time Scale: annual and Start 1981 and End 2021.
19 Same as footnote 15, with Time Scale: annual and Start 2001 and End 2021.