
This article is the latest in a series about computer models and their uses within the Puget Sound ecosystem. Today, we look at the Salish Sea Model, one of several models in the region helping to predict water circulation, water quality and food-web relationships.
Read the full series:
- Six things that people should know about ecosystem modeling and virtual experiments
- Before supercomputers, a structural model helped scientists predict currents in Puget Sound
- Researchers use a qualitative network model to test ways to boost production at shellfish farms
- Health of killer whales examined through Bayesian network modeling and informed predictions
- Quantitative models, including Ecopath, take food web studies to a higher level of analysis
- Prey and predators create varying life-or-death conditions for salmon, as shown with Atlantis model
Where and how the water moves
The waters of Puget Sound contain complex chemical mixtures arising from natural and human sources. The waters are blended and pushed around by currents and other physical forces, creating conditions that vary from place to place. In each place, local water conditions exert a powerful influence over sea creatures, large and small, which assimilate the compounds and, in turn, alter the water conditions.
In 2009, the need to better understand these complex biogeochemical influences throughout Puget Sound led to an effort to design a new quantitative model. The project, led by Tarang Khangaonkar, initially focused on the cause of low-oxygen conditions that plagued vulnerable areas of Puget Sound. [Editor’s note: The Salish Sea Model is currently affiliated with our parent organization the University of Washington Center for Urban Waters.] By 2012, the model was beginning to evaluate how low-oxygen conditions were influenced by human sources of nitrogen, including discharges from sewage-treatment plants.
Since then, the model has been adapted for numerous other studies, including those involving shoreline restoration, impacts from oil spills, results of sea-level rise, persistence of toxic contaminants, and propagation of ocean acidification.
Development of the model
For several years before the development of the Puget Sound model, Khangaonkar, a researcher at Pacific Northwest National Laboratory, had been using a variety of models to study a host of environmental problems. A major question involved which tools are best at helping to resolve complex issues involving deep channels, sinuous shorelines and urban estuaries, as found in waterways like Puget Sound.
The launch of the Puget Sound Model — later renamed the Salish Sea Model — initiated a partnership between PNNL and the Washington Department of Ecology, with funding from the Environmental Protection Agency. Many potential model frameworks were considered by the design team in consultation with a variety of modeling experts. The team eventually decided to couple together two established models — FVCOM for hydrodynamics and CE-QUAL-ICM for biogeochemical calculations — each having a good track record and serving discrete purposes in the new model.
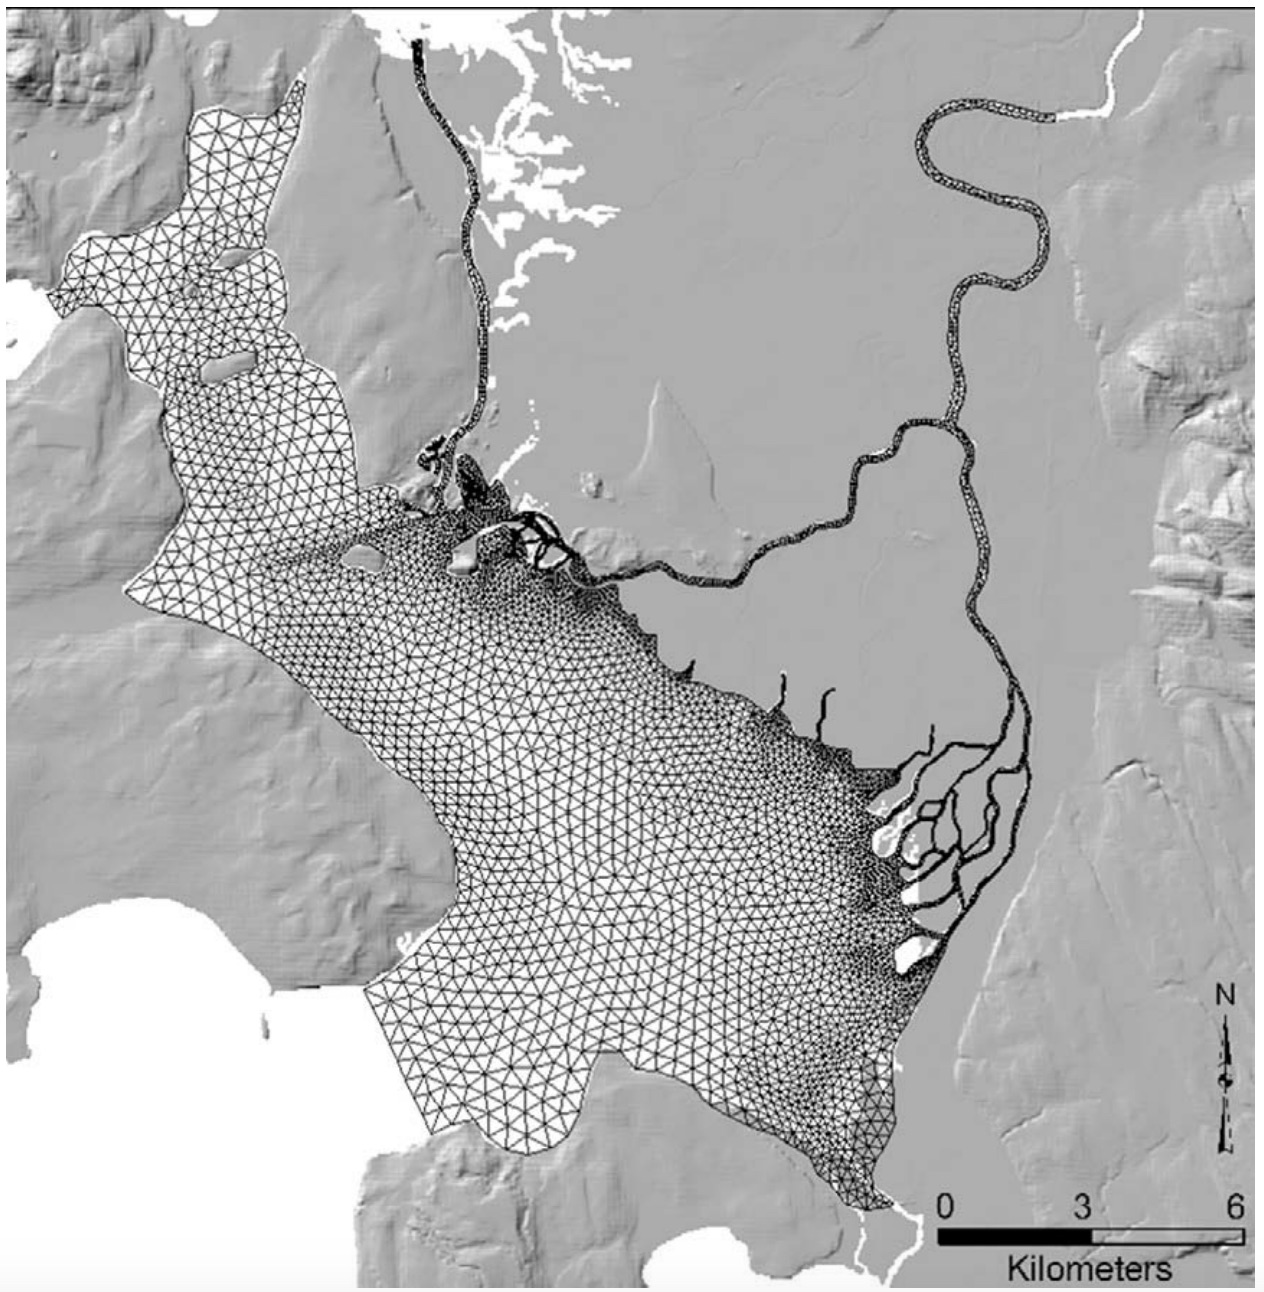
FVCOM — the Finite Volume Community Ocean Model — provides the prescription for an “unstructured grid” consisting of triangles of varying size. This unstructured approach allows the size of the triangles to vary from place to place, depending on the desired resolution for a specific project. Smaller triangles can better trace the sinuous contours of an irregular shoreline. In the study of currents at the Hood Canal Bridge, the grid appears as an elegant design with smaller triangles along the bridge radiating out to larger and larger triangles away from the bridge. See the diagram above.
FVCOM, developed by Changsheng Chen and others at the University of Massachusetts-Dartmouth, was originally applied to the Satilla River estuary in Georgia and the Bohai Sea in China. The model was originally called the Finite Volume Coastal Ocean Model.
The “finite-volume” approach refers to a complex set of mathematical equations used to express oceanic motion and water masses with fixed units of volume while conserving momentum, mass, salt and heat within the system. Inputs needed to drive the model include river inflows and tidal elevations, along with temperature and salinity data for the incoming flows. Weather inputs can come from weather stations or from a separate meteorological model.
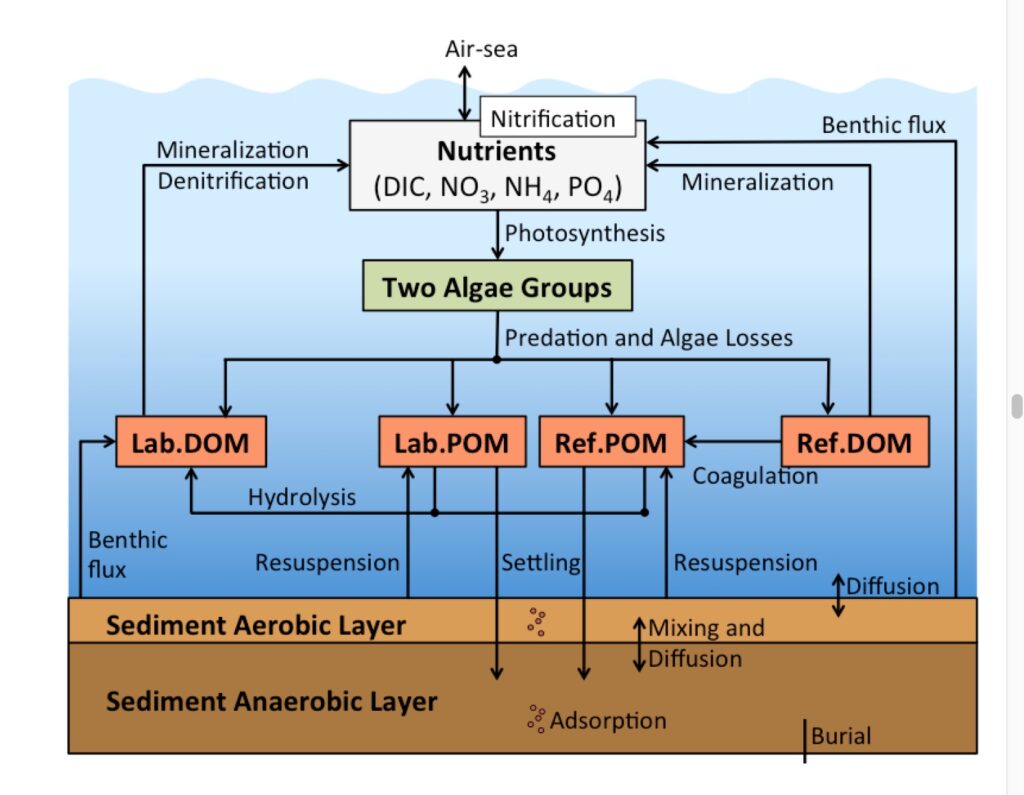
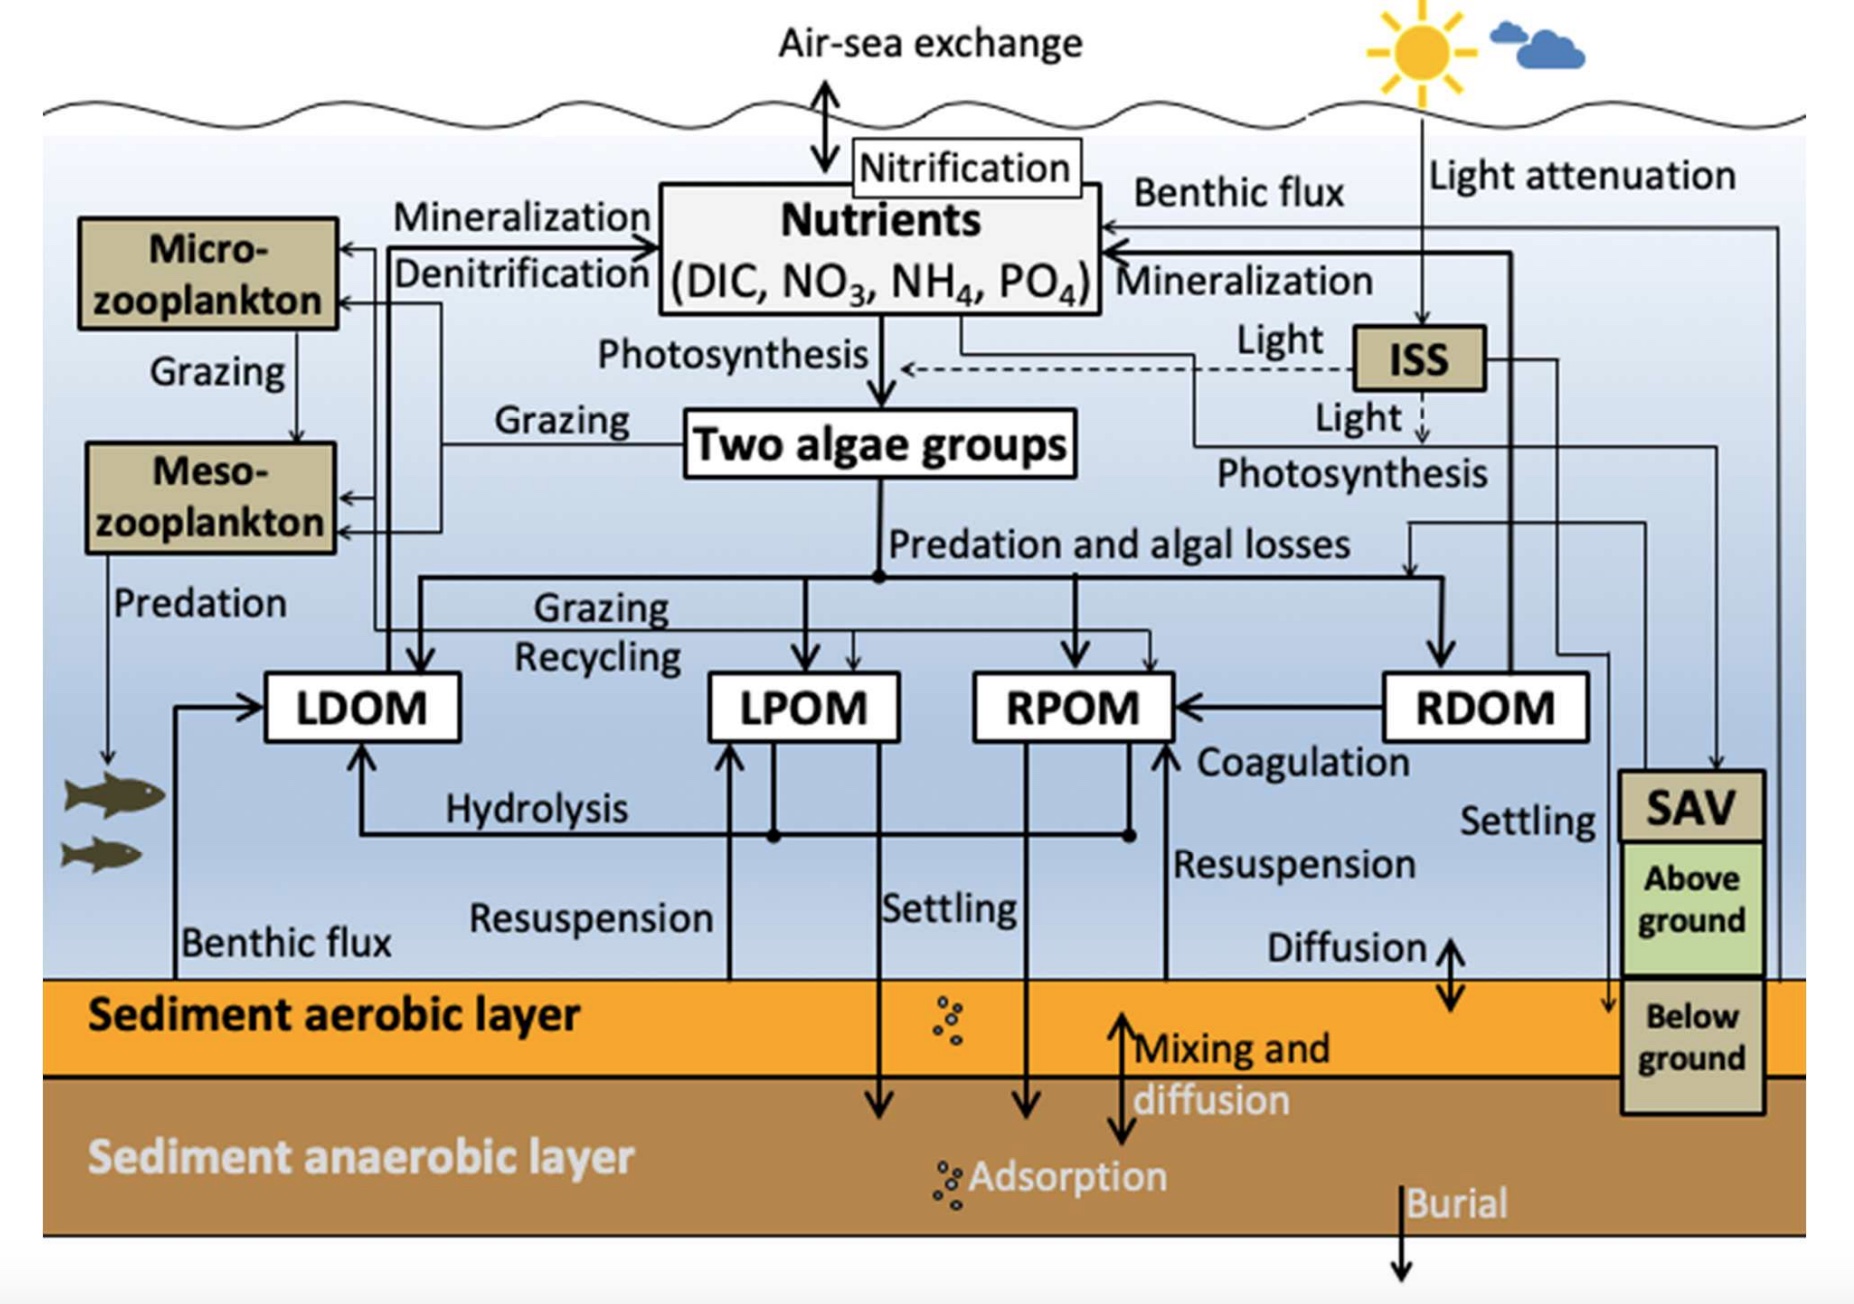
CE-QUAL-ICM provides the equations that cover the biological realm and its connections with the physical world, including these biogeochemical cycles: aquatic carbon cycle, nitrogen cycle, phosphorus cycle, and oxygen cycle.
“QUAL” refers to the model’s primary purpose, as in water QUAL-ity. “ICM” stands for Integrated Compartment Model. The model was developed by the Army Corps of Engineers, giving us the letters “CE” and perhaps the bureaucratic nomenclature.
The first version of the model, created in 1994 by Carl Cerco and Thomas Cole, was used in Chesapeake Bay to predict long-term trends in oxygen concentration and to confirm the role of stratification in the formation and spread of anoxic conditions.
This model accounts for processes involving algae, aquatic vegetation and bottom feeders. It includes a sub-model to calculate the exchange of dissolved oxygen and nutrients between the sediments and water column. (Later, in 2018, a separate module was implemented for Puget Sound to increase the accuracy of the sediment-exchange calculations in the Salish Sea Model.)
In developing the Salish Sea Model, these two models — FVCOM and CE-QUAL-ICM — were joined together in an “offline” approach rather than by “direct coupling.” That is, instead of running the two models simultaneously in a given simulation (with each model feeding back into the other), the Salish Sea model performs the hydrodynamic equations first and saves the results for the biogeochemical kinetics in a second step. This offline method often requires the storage of massive amounts of data pending the second step. On the other hand, direct coupling tends to demand more computing power to run the two operations simultaneously, particularly when simulations are designed to predict changes over many years, as is often the goal in Puget Sound — thus the choice of offline coupling.
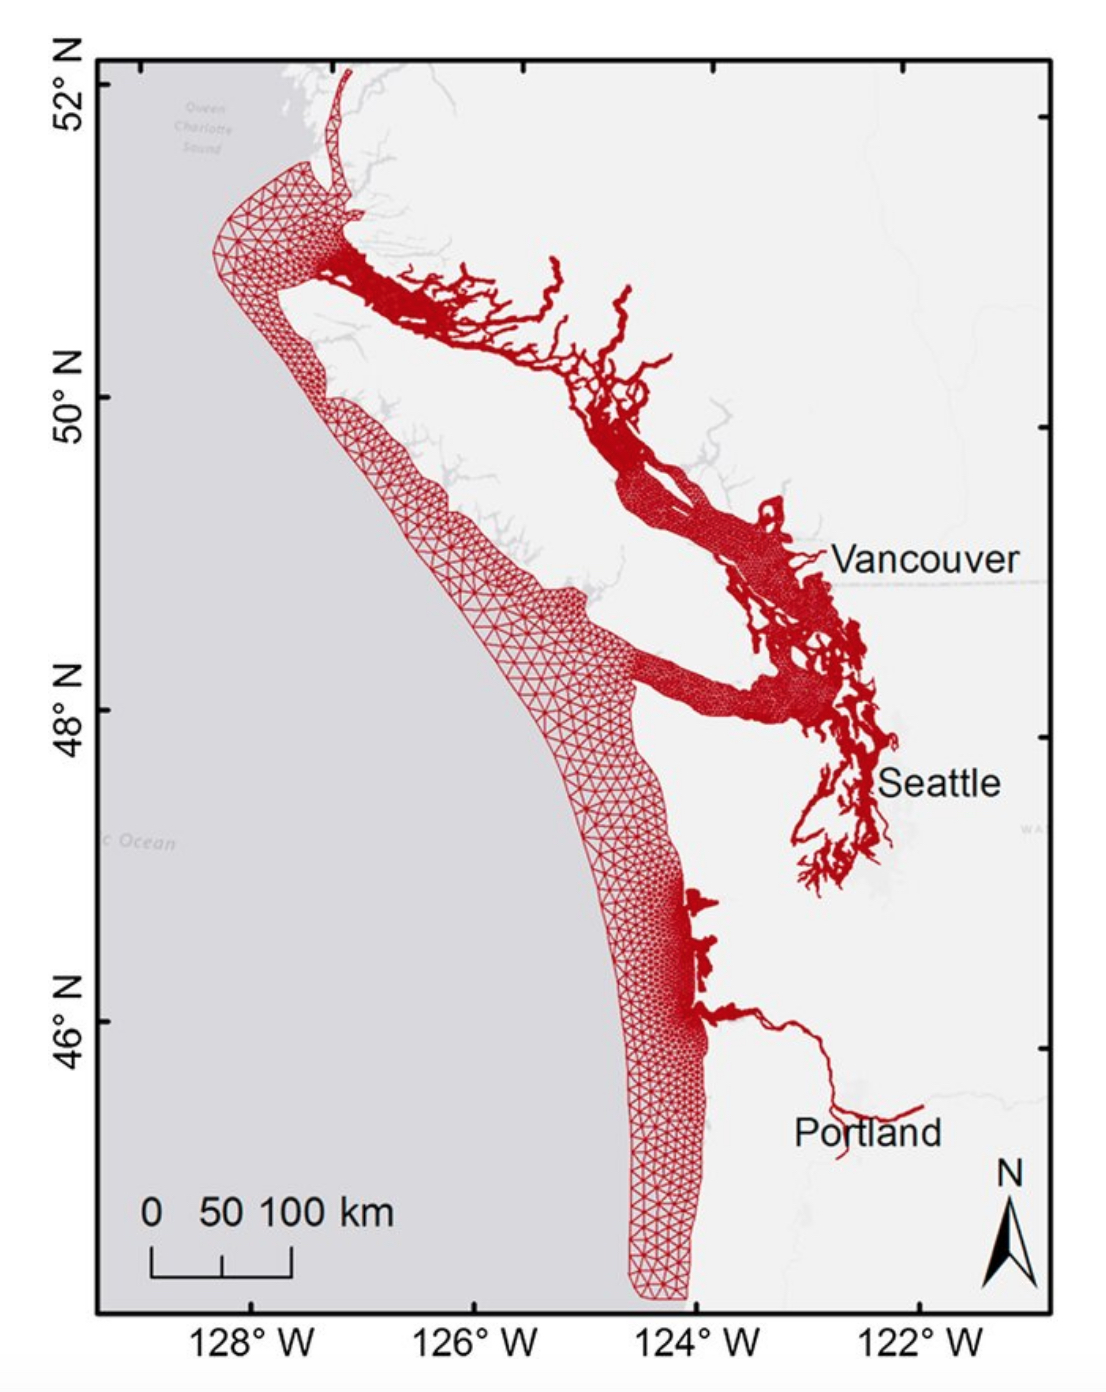
The domain of the model has been expanded since its first iteration. It now covers the entire Salish Sea (Puget Sound, Strait of Juan de Fuca and Strait of Georgia in Canada), but it also covers all of the inland waters around Vancouver Island and areas in the Pacific Ocean out to the continental shelf, reaching south beyond the Columbia River. It also takes in the lower reaches of the Columbia and Willamette rivers in Oregon.
Unlike models using a structured grid, the number and size of the triangles used in the change/motion calculations varies from project to project. Depthwise, the model has 10 vertical layers, with thinner layers at the surface and thicker layers at depth.
After its initial completion, the new model was put through a series of tests, including a large-scale simulation of conditions in Hood Canal, a 68-mile-long hook-shaped fjord known for its low-oxygen problems, particularly in the southern end. Existing data from Hood Canal were used to validate model predictions.
The model was able to reproduce known patterns of temperature and salinity throughout Hood Canal. Biogeochemical simulations captured seasonal changes in chlorophyll, dissolved oxygen and nitrogen, from the surface to the deep water. In a test beyond the seasonal changes, the model was able to replicate the short-term sequence of events that led to a fish kill on Sept. 19, 2006, when stratification, deep currents and winds all played a role in the deadly scene.
*Related: Another computer model that is helping scientists forecast ocean conditions is LiveOcean, developed by the University of Washington Ocean Modeling Group. It makes three-day forecasts of currents, temperature, salinity and many biogeochemical fields in Puget Sound and the Pacific Northwest including harmful algal blooms. A short-term forecast model for the Salish Sea has also been developed by Susan Allen at the University of British Columbia.
A range of models
In 2020, the Salish Sea Model became the centerpiece of a new Salish Sea Modeling Center. Partners included the Center for Urban Waters, affiliated with the University of Washington-Tacoma and the Puget Sound Institute, and Pacific Northwest National Laboratory, affiliated with the U.S. Department of Energy. The center, led by Khangaonkar, now an affiliate professor at the UW Tacoma, is supported by the EPA and other water-quality modeling partners.
The modeling center helps to extend the use of the Salish Sea model even further, into scientific issues of significance throughout the Puget Sound region and beyond. The center also encourages modeling collaborations and the search for tools most appropriate to a given scientific question.
The modeling center supports state, federal and local officials with ecosystem management and restoration of the Salish Sea. Models can help policymakers better understand the environmental effects of climate change, population growth, nutrient loads, watershed runoff, pollution sources and shoreline development among others.
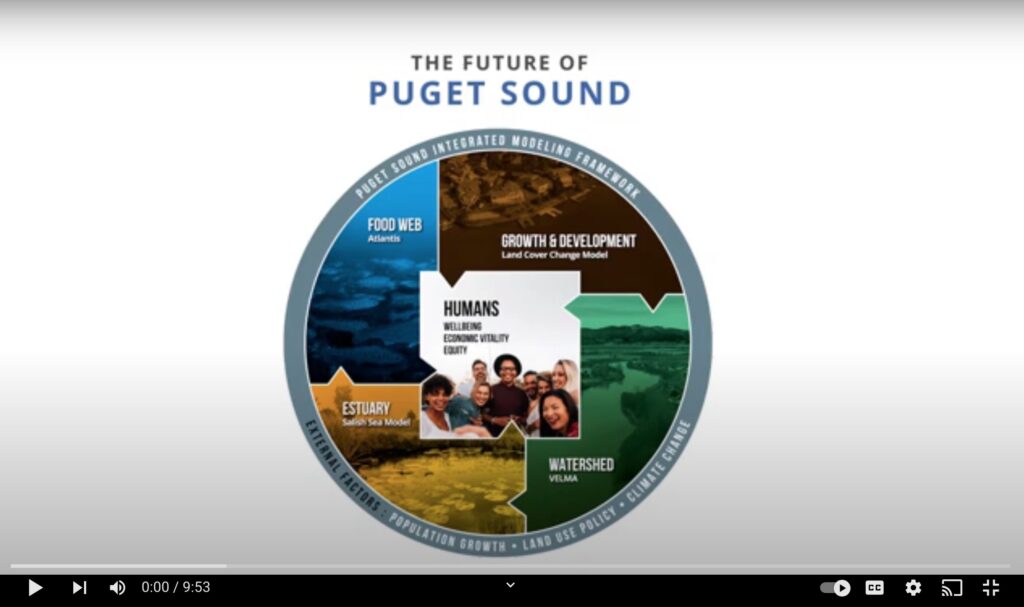
One project connected with the modeling center is the $4.8-million Puget Sound Integrated Modeling Framework. The project, led by Tessa Francis of Puget Sound Institute, will coordinate data outputs from at least five models:
- Atlantis: which follows the movement of nutrients through the food web and predicts the growth of organisms and populations,
- Salish Sea Model, which addresses water quality, currents and biogeochemical interactions within marine waters,
- VELMA, which focuses on watershed activities, freshwater flows and inputs to marine waters,
- Land-cover model, which tracks changes in the landscape and their effects on water movement.
- Socio-ecological model, which predicts how humans affect and react to environmental conditions under various situations.
By using a range of models, each designed in its own way, interested people can hope to see a richer, more accurate, picture of the Puget Sound ecosystem — now and into the future. This approach is expected to broaden our understanding of the connections between natural processes and human activities and thereby improve regional planning and natural resource management.
The new project, announced last fall, is funded in part by the Paul G. Allen Family Foundation. In addition to the Salish Sea Modeling Center, partners include NOAA’s Northwest Fisheries Science Center, EPA’s Office of Research and Development, Long Live the Kings, Pacific Northwest National Laboratory and the Commonwealth Scientific and Industrial Research Organization (CSIRO) of Australia.
In a separate project being developed for NOAA’s National Ocean Service, the Salish Sea Model is being refined for use in real-time ocean predictions and emergency response, including maritime accidents and spills of sewage, oil or chemicals. Other uses for real-time forecasts include rapid warnings of low-oxygen conditions that can affect sea life, acidic waters that can disrupt shellfish hatcheries, and harmful algal blooms that can poison humans and marine creatures.
To meet federal standards as an “operational forecast system,” the Salish Sea Model has been refined with a higher-resolution grid (smaller triangles). Testing criteria, known as a skills assessment, were met after incorporating new data collected by NOAA’s Center for Operational Oceanographic Products and Services. Data on currents were collected from 135 stations over a two-year period.
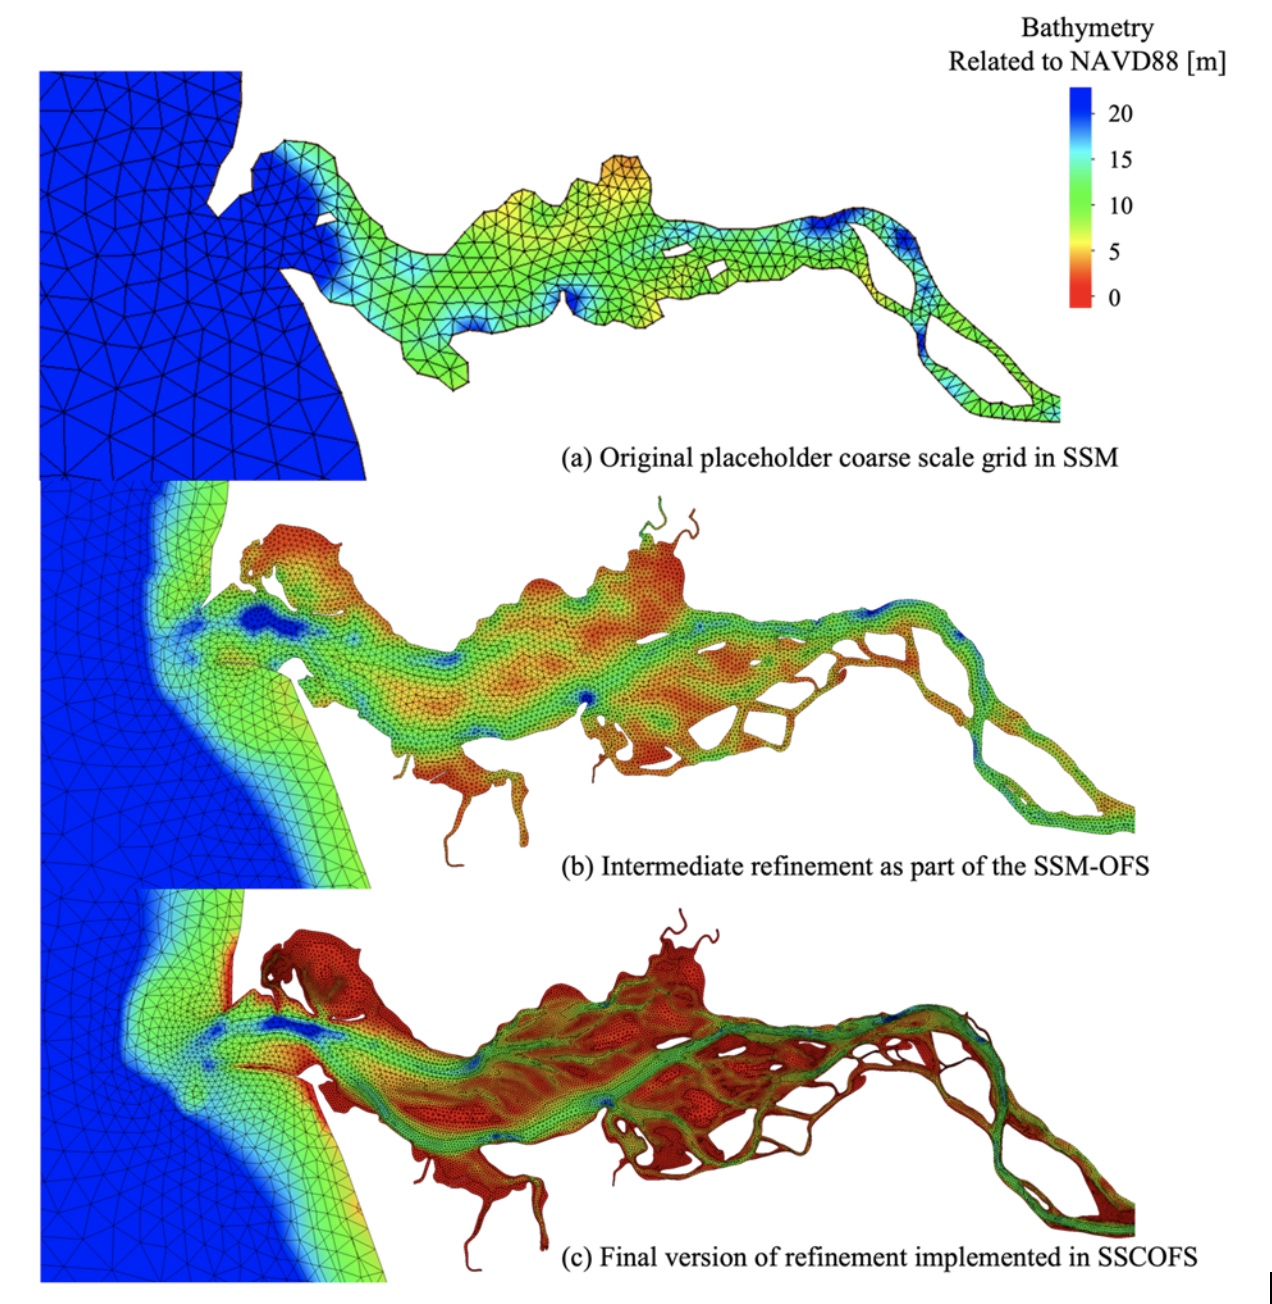
Initially, the refinement and testing was completed for Puget Sound and given the name SSM-OFS for Salish Sea Model-Operational Forecast System. In the third and final year of the project, the Columbia River estuary was added to the model’s high-resolution domain to support emergency operations in that area. The change added 146 miles along the Lower Columbia River — from Astoria at the mouth to Bonneville Dam, 40 miles east of Portland. With testing complete, the model has been designated SSCOFS — the Salish Sea and Columbia River Operational Forecast System. For details, see Integrated Ocean Observing System.
The final steps are underway to put SSCOFS into active operation, which is planned for next year.
Su Kyong Yun and Adi Nugraha, members Khangaonkar’s modeling team, are working on an update to the operational model for Puget Sound by adding capabilities that will provide two-day forecasts of water quality, updated each day, at selected locations throughout Puget Sound. This capability will coordinate with work by Wenfei Ni, another team member, who is nearing completion of a fecal bacteria module that will allow the Salish Sea Model to simulate bacterial concentrations in specific locations, such as commercial shellfish beds.
Publications involving the Salish Sea Model
2014 – Puget Sound Dissolved Oxygen Assessment: Concerns about low-oxygen conditions in Puget Sound were a major impetus behind development of the Salish Sea Model, initially called the Puget Sound Model. After model validation, researchers began to put the model to use by studying how nutrient loads from natural and human sources led to excessive algae blooms. It was already known that low-oxygen conditions can occur when the algae die and the natural process of breakdown by bacteria reduces available oxygen, particularly in deep waters and in inlets where mixing is slow.
The 2014 assessment revealed that the human contributions of nitrogen from sewage-treatment plants have greater effects on oxygen levels than watershed sources, which include fertilizers and many other non-point sources carried to Puget Sound by streamflows. The model also showed that inflows from the Pacific Ocean strongly influence oxygen levels in Puget Sound and could have a much greater influence in the future if declining oxygen trends continue.
The model also took a first look at the effects of climate change related to decreased streamflows coming into the Salish Sea. The general finding was that some areas would sustain greater effects of low oxygen than others. Also, warmer air temperatures are expected to decrease oxygen levels, particularly in shallow inlets, according to the assessment.
2017 – Ocean acidification and regional anthropogenic nutrient sources: Monitoring of ocean acidification led some researchers to suspect that local biological processes resulting from human nitrogen sources may be contributing to ocean acidification — in addition to that caused by worldwide increases in atmospheric carbon dioxide.
An ocean acidification module was developed to allow the Salish Sea Model to predict changes in the concentration of calcium carbonate, particularly the type used by shell-building organisms. Without sufficient calcium, much of the food web would be at risk, according to environmental experts who wanted to know what the future might hold for shelled creatures under various scenarios and if anything could be done to help the Puget Sound ecosystem. See “approach” report, 2014.
Results showed that increased nitrogen, increased phytoplankton and increased organic carbon caused by human nutrient sources can significantly increase acidification in the Salish Sea. Declines in calcium carbonate needed to form shells were found to be related to regional human sources of nutrients. Particularly low levels of calcium carbonate were projected for southern Hood Canal, the Whidbey Basin (Port Susan, Saratoga Passage and Skagit Bay) and to a lesser extent Elliott Bay, Commencement Bay, Colvos Passage and the deepest areas of South Puget Sound.
2017 – Assessment of circulation and inter-basin transport: Although circulation patterns have been studied in many localized regions of the Salish Sea, researchers had not studied the hydrodynamic interactions of all the various waterways as a single unit. Although most of the water flows in through the Strait of Juan de Fuca, a big question was the influence of flows through Johnstone Strait and the complex channels along Vancouver Island.
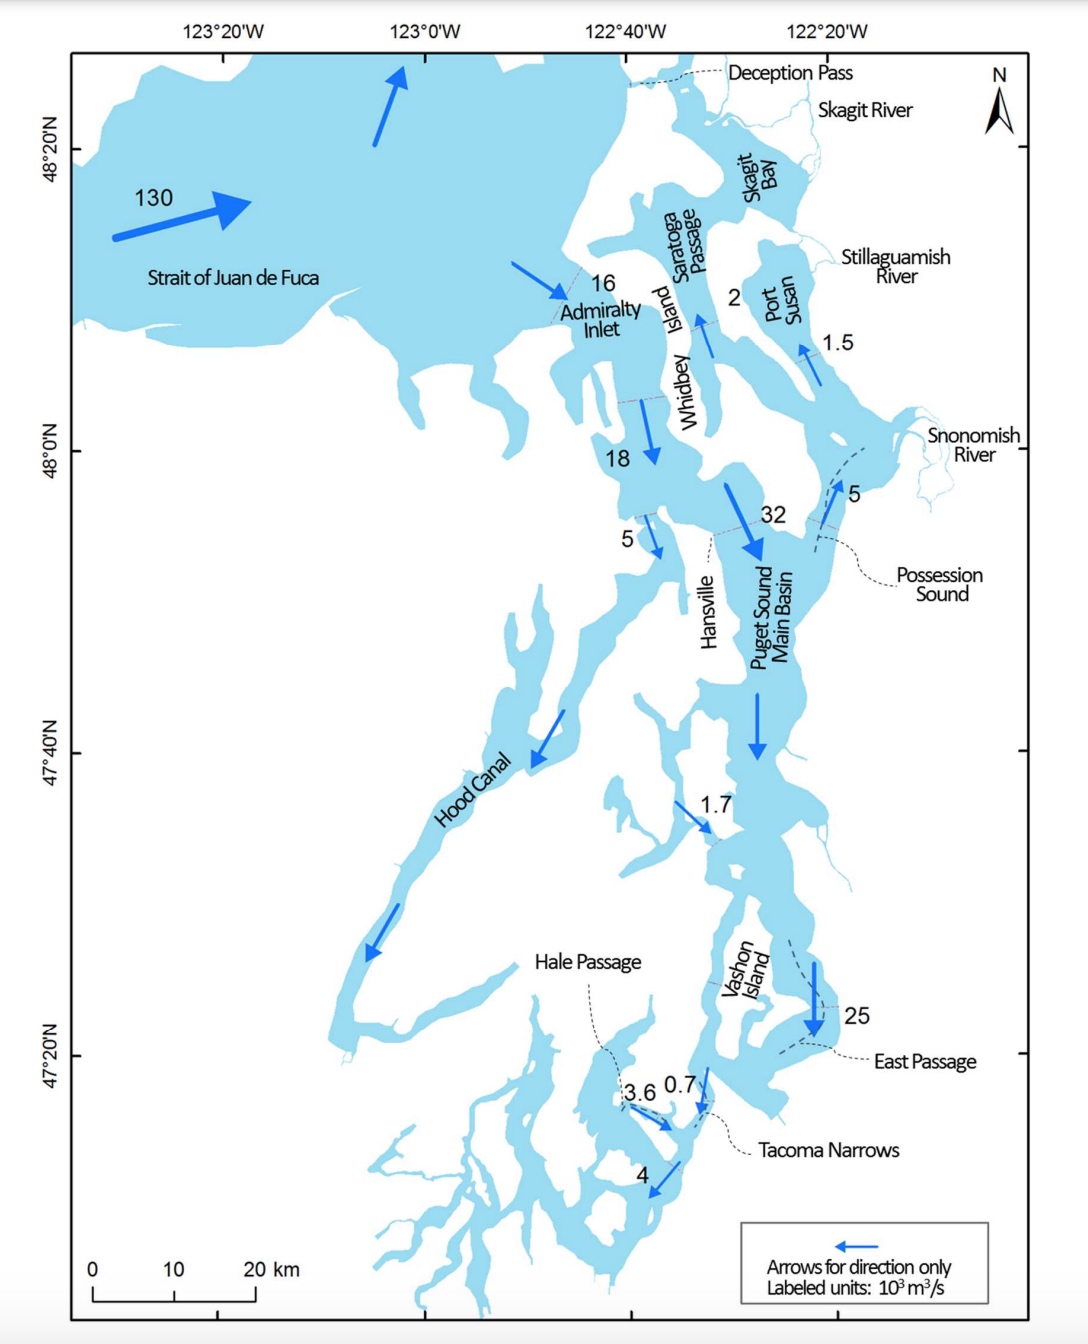
For this project, the Salish Sea Model was expanded well beyond Puget Sound to encircle Vancouver Island and associated waterways. The result was quantitative estimates of tidal flows throughout the system, including typical estuarine circulation with surface flows generally moving outward toward the ocean and deep waters moving inward.
The study confirmed that two underwater hills, known as “sills,” constrain the flushing of Puget Sound to a significant degree. Rather than pollution moving out of Puget Sound on a one-way street, the model showed that 60 percent of the surface water returns as “reflux” resulting from the currents at sills in Admiralty Inlet and the Tacoma Narrows.
As for the effect of Johnstone Strait, “sensitivity tests with and without exchanges through Johnstone Strait demonstrate that it is a pathway for Georgia Basin runoff and Fraser River water (both in Canada) to exit the Salish Sea and for Pacific Ocean inflow,” the report says. “However, the relative impact of this exchange on circulation and flushing in Puget Sound Basin is small.”
2019: Nearshore effects of climate change and sea-level rise: The effort to understand global sea-level predictions at the local and regional levels led to this project, which includes an analysis of the future interactions between rivers and their estuaries as sea levels continue to change. The model used greenhouse gas emissions scenario RCP 8.5, a high emissions rate.
Findings suggest that Salish Sea waters will continue to warm, going up by 1.51 degrees C. (2.72 degrees F.) from the year 2000 to 2095. The Snohomish River estuary is predicted to go up by 3 degrees C (5.4 degrees F), in part because of river flow across the delta.
Rising sea levels are expected to increase seawater intrusion as far upstream as 11 miles, compared to 4 miles in historical conditions.
Hypoxia (dissolved oxygen below 2 milligrams per liter) is expected to occupy 16 percent of the Salish Sea — including the majority of Hood Canal — by 2095, compared to less than 1 percent today. Annual averages of dissolved oxygen throughout the Salish Sea are expected to drop by 0.7 mg/l.
Although the changes are alarming, it’s worth noting that the study found less severe conditions in the Salish Sea than on the continental shelf boundary, probably because of strong vertical circulation that keeps Salish Sea waters cooler, more oxygenated and less acidic.
2018 Hood Canal bridge zone of influence: The low-oxygen conditions of Hood Canal are well known, and some researchers have suspected that the Hood Canal floating bridge may be contributing to the problem by reducing the rate of surface flow. After all, the bridge pontoons form a fairly solid barrier going down 15 feet into the water where the bridge crosses Northern Hood Canal.
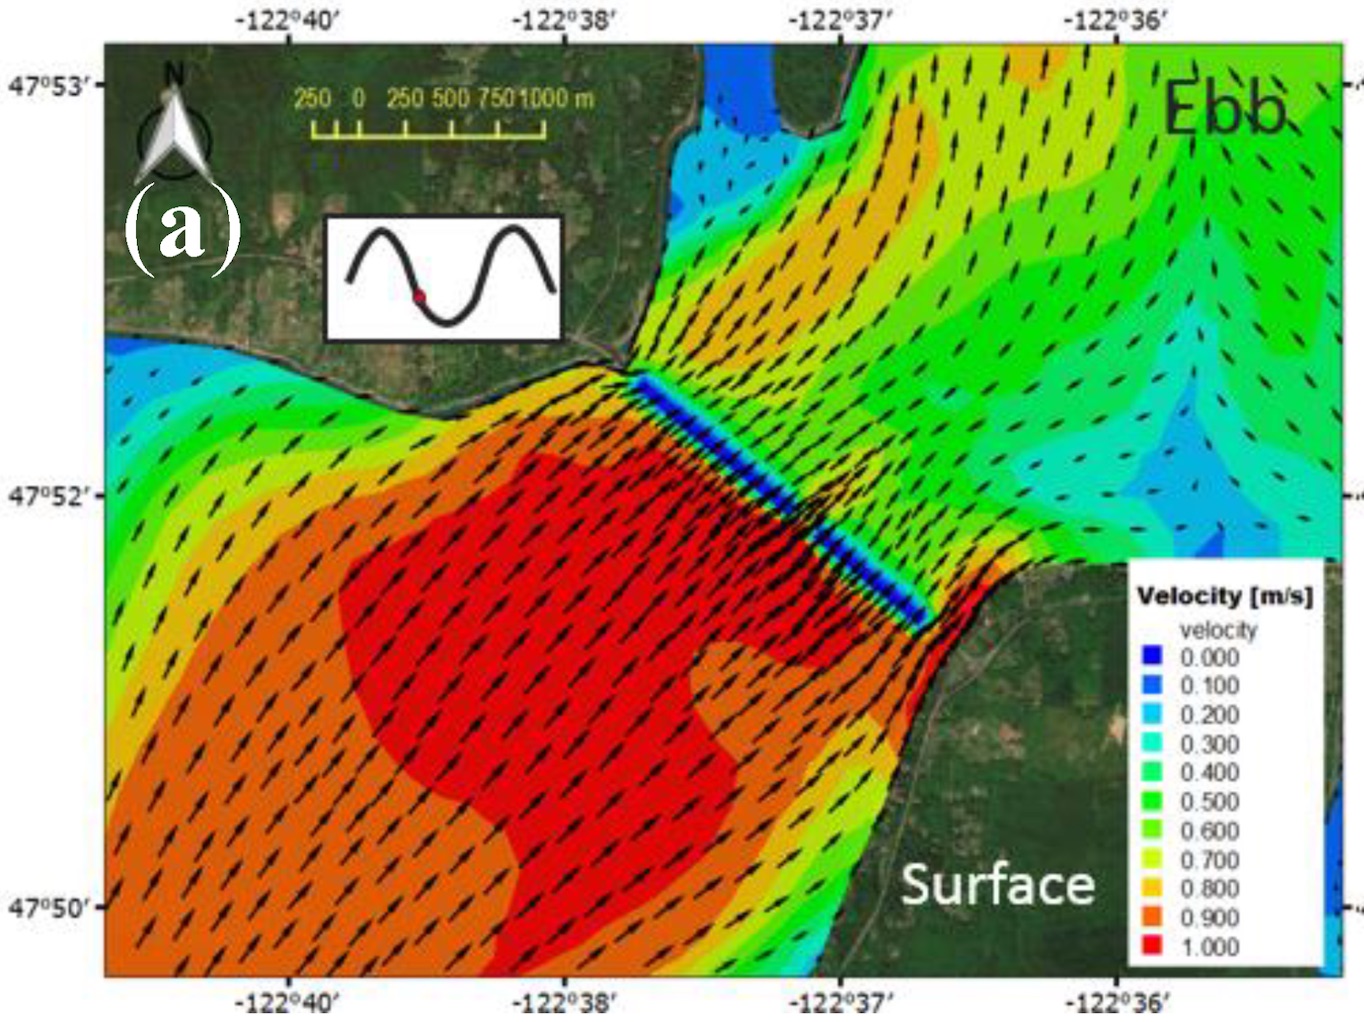
Modeling the three-dimensional flows at the Hood Canal bridge confirmed the blockage, resulting in increased mixing at the bridge with strong down-currents and up-currents, along with changes in salinity and temperature, as the tides go in and out. While the effects at the bridge are relatively strong, those effects drop off with distance. For currents, the effects are less than 10 percent beyond 2.1 miles to the north of the bridge and 1.3 miles to the south.
As a result, the study shows that the overall hydrodynamic effects of the bridge — particularly on dissolved oxygen in Southern Hood Canal — are not significant.
2019 Nutrient Source Reduction project, Volume 1: Reducing nitrogen and carbon discharges at sewage-treatment plants was shown to improve dissolved oxygen levels in Puget Sound, according to findings from the Department of Ecology using the Salish Sea Model. For example, if nutrient reductions were implemented at all 79 municipal treatment plants discharging into Puget Sound, the total area out of compliance with water-quality standards would drop from 20 percent of Puget Sound to 10 percent.
“It is clear from the modeling study that it will take a combination of nutrient reductions from wastewater treatment plants and other sources of nutrient pollution in watersheds to meet marine water quality standards,” the report concludes.
2020: Algae, eelgrass, and zooplankton under future climate conditions: This climate-change study takes a closer look at climate-change effects on lower trophic levels in the food web, including phytoplankton and zooplankton species, along with consequences for higher-level species. The study also considers how aquatic vegetation, such as eelgrass, might play a role in reducing the effects of low oxygen and acidification.
Results confirm that under a scenario of high greenhouse gas emissions (RCP 8.5) we can expect that species living on or near bottom sediments will experience substantially greater exposure to low-oxygen waters by the year 2095 — as much as 52 times greater exposure when measuring both the area of low oxygen and the number of days of occurrence. Similarly, these species are projected to experience greater exposure to corrosive pH levels related to acidification.
Refinements in the Salish Sea Model allow for zooplankton species to be studied as micro and meso groups, as opposed to lumping all zooplankton together. Since zooplankton vary widely — from copepods to crustaceans to jellyfish — they respond differently to environmental conditions. Along with many refinements in this configuration, the flow of nutrients is better replicated when microzooplankton are set as the primary predators of phytoplankton, while mesozooplankton are viewed primarily as consumers of smaller zooplankton. The outcome improves model predictions of seasonal changes in plankton growth and provides a greater understanding of the differences among various regions within Puget Sound.
While the eelgrass module is still in an early stage of development, it appears that eelgrass biomass could be reduced by nearly 50 percent as a result of increased temperature, increased salinity and reduced light in nearshore environments. While eelgrass can help to improve water quality in an eelgrass meadow, larger-scale effects of eelgrass are considered minimal. The eelgrass module was developed by Adi Nugraha, a member of Khangaonkar’s modeling team.
2022 The “blob” and propagation of a heat wave through the Salish Sea: The marine heatwave of 2014-2016, which had profound effects on sea life along the West Coast, was examined in Puget Sound from a hydrodynamic and biogeochemical perspective using the Salish Sea Model. While many researchers suspected that higher temperatures were the cause of increased phytoplankton growth and, in turn, greater zooplankton growth, the model showed less of a temperature increase than on the coast due to vertical circulation and mixing of deeper waters in Puget Sound. The large planktonic growth turned out to be related not so much to higher water temperatures but to increased freshwater flows bringing more nutrients into Puget Sound, along with more estuarine exchange with the Pacific Ocean.
“One of the more challenging tasks for scientists can be to parse the full range of effects born of large events,” writes Eric Wagner in an article in PSI’s Salish Sea Currents. Wagner tells the story of how Tarang Khangaonkar and his associates at the Salish Sea Modeling Center were able to crack the mystery of what was driving the ecological events related to the “blob.” Khangaonkar explains the study in a video.
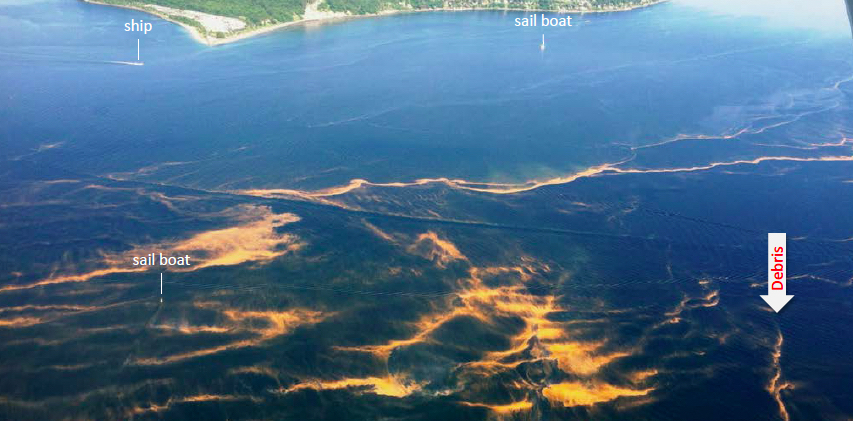
2022 Quantification of residence and flushing times in the Salish Sea: Understanding the complex currents of the Salish Sea can help with practical questions, such as how long toxic pollution remains before being flushed out to sea, where raw sewage goes after an overflow, or what happens to oil spilled from a barge or along the shore.
For the first time, new data related to currents at 135 stations in the Salish Sea provides enough information to formulate solid answers to questions of residence and flushing times — how long the water stays around and how long it is replaced by incoming flows. Information needed for model validation and skill assessment came from acoustic doppler current profile (ACDP) data collected by NOAA’s Center for Operational Oceanographic Products and Services.
To begin, this paper better defines residence time, which relates to the time a hypothetical particle spends within a defined area of the waterway. The model assumes between 25,000 and 450,000 particles, depending on the area in question, and it can calculate the average time a particle sticks around as well as the time it takes for 90 percent of the particles to leave the area.
Flushing time, which relates to volumes of water coming into the area, was redefined with consideration for the bathymetry variations, internal tides and freshwater inflows to the specific area. Flushing time becomes the time it takes for a hypothetical dye that has been spread throughout the waterway to reach essentially 37 percent of its initial concentration — a process technically known as the e-folding flushing time.
The study found that flushing times vary by season, with longer times in summer when tides are lower and freshwater flows are lower. But, surprisingly, flushing times are significantly longer in winter in fjord-like basins such as Hood Canal (138 days), where stratification reduces mixing. The model calculated residence and flushing times for 36 sub-basins to increase our understanding of local conditions and show how long it takes to reduce pollution in various bays and inlets. The flushing time for Puget Sound as a whole was found to be 115 days, while Georgia Basin is 240 days.
In the works: Modeling the fate and transport of PCBs in Puget Sound: Studies through the years have shown a persistence of PCBs in the fish living in Central and South Puget Sound, despite a ban in the 1970s that severely restricted the levels of PCBs allowed in products. The studies seem to confirm that PCBs are still biomagnifying, with lower levels in organic matter found in water and higher levels in predators going up the food web. See Encyclopedia of Puget Sound.
To tackle the complex problem of where the PCBs are coming from and how they are passed along, modelers have developed a new PCB fate-and-transport module for the Salish Sea Model, calibrated with samples of algae, krill and particulate matter from Seattle’s Elliott Bay, which is known for its PCB contamination. Model scenarios have been conducted using varying loads of PCBs to search for potential pathways of PCBs from unknown sources. The work is led by Lakshitha Premathilake on Khangaonkar’s modeling team. Preliminary results are to be reported during the November conference of the Coastal & Estuarine Research Federation.